The art (and science) of clustering
By: Andrew ‘Chalky’ Chalk PhD., Technical Specialist – Data Science (New York)
Accurate and precise targeting is the holy grail of marketing – both a treasured goal and a challenging feat to achieve. But with marketing and advertising technologies enabling smarter capabilities, we’re progressing closer and closer to unlocking the potential of this elusive tool. One such solution that is enhancing targeting and segmentation methods in marketing is cluster analysis.
What is cluster analysis?
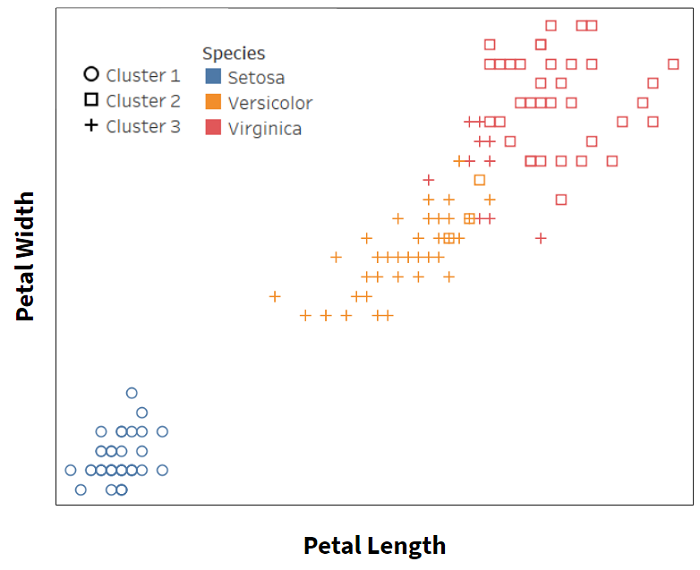
Cluster analysis is the application of unsupervised machine learning algorithms to find groupings, or “clusters” within a set of data. The defining feature of a cluster is that its members are ‘similar’ as possible with each other and as dissimilar as possible to members of other clusters. This can be illustrated using this classic ‘iris’ dataset example which contains measurements of three types of iris flowers. The chart to the left shows the results of applying a simple clustering technique, k-means, implemented in Tableau Desktop data visualization tool.
The clusters calculated by k-means are shown as shapes whilst the species of the flower is shown as colors. Although k-means was given only measurements, the clusters determined are found to correspond quite well with the species of the flower. All of the Setosa are in one cluster and the majority of Versicolor are in cluster 3 and Virginica in cluster 2.
Application of Clustering to Geographic Features
The original motivation for this work was to enhance the relevancy of Rokt’s technology through the inclusion of geographic data, namely zip code into Rokt’s machine learning algorithms. Given that there are more than 40,000 zip codes in the US, this is a challenging problem. There are various ways to approach this, but we decided on clustering because it has the added benefit of producing clusters that can potentially be labeled so that we get a better understanding of the type of people living within a zip code.
We have taken zip code-linked data from the 2017 American Community Survey (ACS) and the 2010 US Census. The ACS collects detailed information on a yearly basis about households in the US but is only sent to a small subset of the population. Both are freely available for browsing and download at the US Census Bureau website. We have selected a subset of the available data intended to capture the life stage and disposable income of residents of each US zip code. Broadly, we include the following categories:
1) Age distribution
2) Household income distribution
3) Percentage of households with married couples
4) Percentage of households where children are present
Rather than use the well-known k-means method, we used the Gaussian Mixture Model (GMM) implemented in the Python package scikit-learn. We made this choice due to the fact that it makes fewer assumptions about the shape of the clusters identified. All variables were transformed into Z-scores prior to clustering to ensure that differences in scale did not affect the results.
Clusters Identified
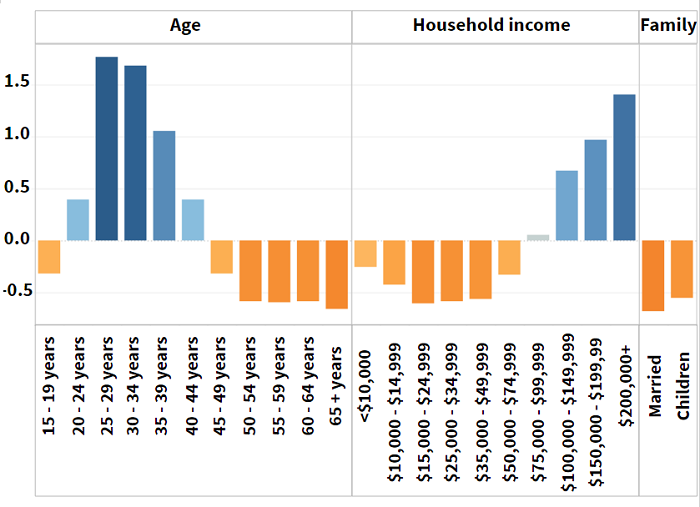
We explored in detail one of the 20 clusters that we identified. The chart to the right shows the center of the cluster as Z-scores. Blue bars indicate that the category is higher than average and orange is below average. Thus, this cluster represents a population having a greater proportion of higher incomes and unmarried millennials than the average for the US as a whole.
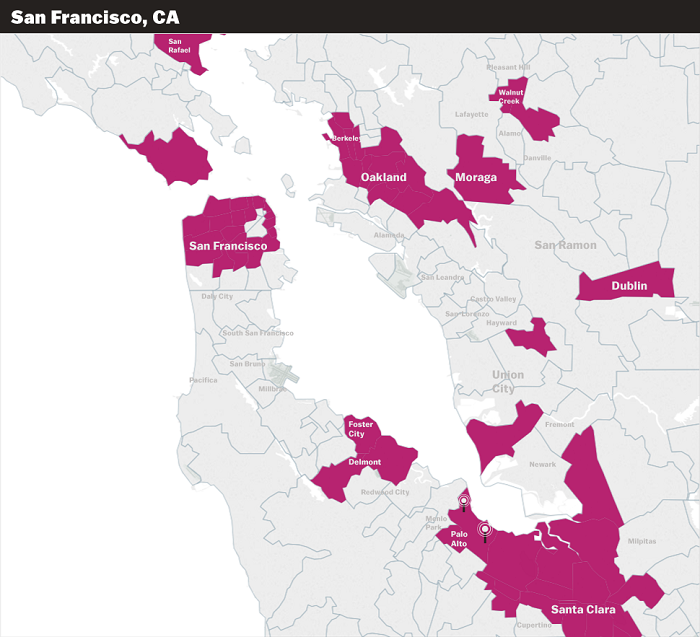
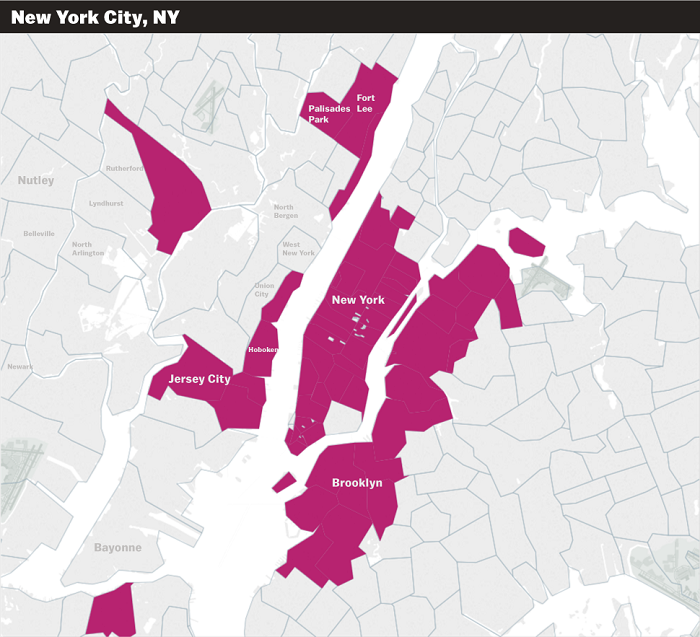
Next, we look at the geographical distribution of members of this cluster. As can be seen below, this cluster (shown in beetroot) exists in pockets around what looks to be major cities.
Let’s look closer at the areas surrounding major cities:
Note that the offices of large technology companies such as Facebook and Google are located in silicon valley to the bottom right of this map.
The Headquarters of Microsoft is located in Redmond near the center of the map.

This cluster covers most of Manhattan and the adjoining areas in Brooklyn and New Jersey.
To summarize, members of this cluster typically live in urban environments or close to technology hubs such as Silicon Valley. Given the above, we have named this cluster ‘Tech Savvy Urban Millennials.’
Using data from the Rokt marketplace, we examined the preferences (based on conversions per impression) of members of this cluster for different categories of advertisers across the Rokt marketplace. These results are summarized qualitatively below.
| Above Average | Below Average |
| Food and Beverage | Travel |
| Retail | Ticketing |
| Services (e.g. Medical, Charities) | Media and Entertainment |
One possible takeaway from this is that Tech Savvy Urban Millennials are interested in products and services that make their lives easier but have less time to focus on leisure, travel or entertainment due to their busy work schedules.
Applications at Rokt
The two main applications of this work at Rokt are in improving our targeting capabilities and increasing relevancy through the addition of the clusters to Rokt’s machine learning algorithms. Tests of both of these applications are ongoing.